Importance of Data Visualization
Enron Corporation
Enron Corporation was once one of the world’s biggest corporations. From its beginnings as an interstate natural gas supply company in 1985, it grew steadily throughout the 1990s, diversifying into nearly every form of energy transaction and eventually dominating the energy trading business. Its stock price followed this spectacular growth. In 1985, Enron stock sold for about $5 a share, but at the end of 2000, Enron stock closed at a 52-week high of $89.75, and the company’s stock was worth more than $6 billion. Less than one year later it hit a low of $0.25 a share, having lost more than 99% of its value. Many employees who had taken advantage of generous stock plans lost retirement packages worth hundreds of thousands of dollars.
Portfolio managers typically examine stock prices (or changes in stock prices) over time to determine stock volatility and to help them decide which stocks to buy and sell. Were there warning signs in the data?
To learn more about the behavior and volatility of Enron’s stock, let’s start by looking at below table which gives the monthly changes in stock price (in dollars) for the five years leading up to the company’s failure.

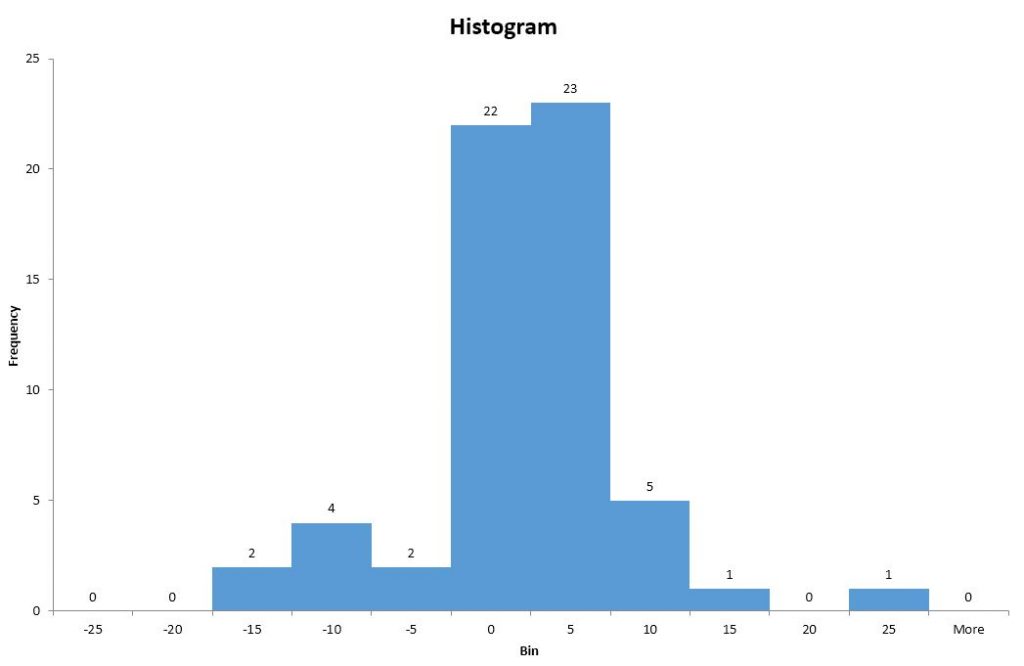
It is hard to tell very much from this tables of values like this as you can say there were many instances where stock has changed to negative values and also towards positive and based on that we can not make a solid conclusion because still we are not much clear that for how many times and for how much this share had went negative and positive. To illustrate that let us plot data on histogram and discuss.

This histogram clearly explains that even though this share had its highest gain by $25 for once, it has been a tipsy journey for Enron as we can see there were almost equal number of instances of gained and lost. Let us take the simple fact of probability of going share towards positive value is 30/60 = 50% (# of times of positive monthly gains / total # of months).
Now tell me, would you have invested in Enron?

